Data analytics in marketing has grown in importance with the emergence of big data. Businesses and organizations are relying on factual data for decision-making.
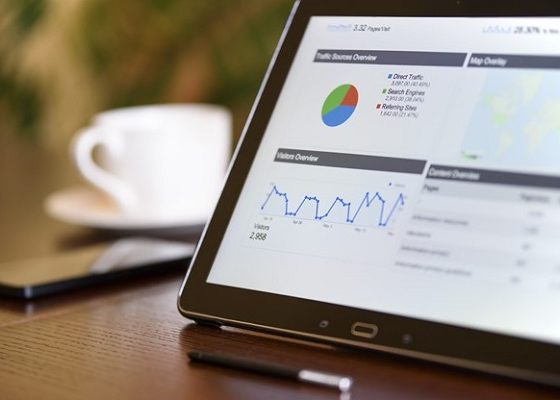
Data analysts use visualization tools like a Sankey diagram, histogram, chart, and infographic to represent data visually. That way, it’s easier to access the data and get insights.
You must be wondering, what is data analysis, and why is it important? By the end of this guide, you will understand why you need data analysis in marketing.
Let’s dive in!
What is Data Analysis?
Data analysis involves collecting, cleaning, modelling, analyzing, and visualizing data. The purpose of data analysis is to extract valuable insights used for decision-making.
The amount of data on the internet is growing every day. At least 2.5 quintillion bytes of data are produced daily. Yes, you read that right.
Visualization like a Sankey diagram can show how raw materials come from one country to different countries. It gets better if it can show how finished products are sold back from various countries.
Data analysis in marketing has evolved from measuring costs and sales to measuring other multiple variables that drive sales.
The variables are – brand opinion, market trends, consumer behaviour, clicks, usage, time spent, frequency, pages per session, traffic distribution, subscriber rate, lifetime value, brand awareness, etc.
Data Analysis Process
Before we look at the various types of marketing, let’s start with an example. You’ve been running a Google ads campaign. You want to know the ad performance and whether you have a return on investment
(ROI). So how do you go about this?
Now, this is where data analysis comes in. You will have to gather details about the campaign and represent the data in a graphical or pictorial format.
Analyzing the data for the campaign starts from information gathering to visualization. But in between, several other processes are involved. So, let’s find out more.
Start by gathering data requirements.
Before you carry out data analysis, you should ask yourself, why do I need the data? What is the purpose of this analysis? That way, you will know what to analyze and how to measure the results.
For instance, in marketing, what do you want to analyze? Is it a PPC campaign, customer engagement, Google Analytics results, or social media campaigns?
Make sure you have an idea of the data you want to collect and set clear goals.
Data Collection
After that, you’ve set the objectives and purpose, the next step is to collect the data. You can store it in a table for analysis. The best way to save the data is in an Excel worksheet. Organizing the raw data makes it simple to analyze.
Data cleaning
You’ve collected a lot of data, and now it’s time to clean it. Cleaning means removing duplicate content, unnecessary information, punctuations, and irrelevant data. You aim to remain with relevant, accurate data for analysis.
Analyzing the data
Before analyzing the data, make sure that it’s accurate and captures the necessary information. You will need data analysis tools like Excel, Power BI, and R to understand and interpret the data.
Data Interpretation
Therefore, now it’s time to interpret the results. Do you have an idea of how to present the information? Is it in a table, chart, graph, or plain text?
Data Visualization
Now, this is the final process of is about representing data in a visual format that is easy to understand. Microsoft Excel is a visualization tool that does not require coding to visualize data.
There are multiple visualization tools to use. Sankey diagrams, charts, or graphs are types of data visualization formats you can use.
Human beings are very visual. Data makes sense in marketing and other areas when visualized and tells a story. That is how data can be compelling and increase decision-making speed.
Importance of Data Analysis
Data analysis has been made simple by data visualization tools such as Sankey charts, Dot plot chart Google charts, heatmap, waterfall chart, Infogram, and ChartBlocks.
The visualization tools help you to tell a story. They capture the attention, make data more interesting and digestible than looking at a bunch of excel sheets or Google sheets with plain data.
A tool like a Sankey diagram generator has more advantages then other or data visualization tools. It shows moving data, and based on the data size, you can tell how much goes to a specific destination.
Instead, the current digital space, marketing relies on data analysis. Visualizing the data helps to draw insights and make future predictions.
Although, the social media platforms have already automated data processing and decision-making by using algorithms in marketing.
Frequently Asked Questions
What are the types of data analysis?
As well as, a data analyst, you should be aware of the various types of data analysis to use. Text, statistical, diagnostic, predictive, and prescriptive analysis are the most common types.
How is data analysis used in marketing?
Therefore, the digital evolution, data analysis plays a crucial role in marketing. It helps you understand the customers and make better decisions that impact your brand. For instance, you can create a marketing strategy based on your insights from the analysis.
How does storytelling apply in data analysis?
For example, after analyzing social media campaigns, the next step is to visualize them. As the data analyst, you decide to visualize the data in an infographic with facts and a data story.
Stories are 22 times more memorable than using facts alone. Data means nothing without context and a story. A story inspires insights, and data becomes proof.
In Conclusion:
It is the process of gathering, collecting, cleaning, analyzing, interpreting, and visualizing data. Without data analysis, decision-making would be without basis and would depend on notions and unanalyzed experiences.
Although, the incorporation of data visualization and storytelling activates more portions of the brain, creating more sensory inputs and making information more insightful and memorable.
However, you want to be careful with data analysis. Numbers don’t lie, but poor or erroneous analysis and visualization can lie.